3.3 基因本体(GO)中各 BP、MF 和 CC 的富集分析
Gene Ontology (GO) 系统中的三个本体类别
"BP", "MF", "CC" 是 Gene Ontology (GO) 系统中的三个主要本体类别。这三个类别旨在提供一个全面且分层的框架,用于分类生物学功能和过程及其发生的地点。GO 被广泛用作系统描述基因和蛋白质功能的通用语言。
-
BP (Biological Process): 生物过程本体描述生物学对象(如分子或细胞)参与的生物事件和活动。这包括单个生物学对象执行的功能或多个成分协同进行的过程。例如,细胞周期、代谢和信号传导等过程。
-
MF (Molecular Function): 分子功能本体描述生物学对象在分子水平上的活动。这指的是生物过程中执行的特定任务。例如,DNA 结合、酶活性和受体活性等。
-
CC (Cellular Component): 细胞成分本体描述细胞或细胞外环境中生物学对象的位置,或它们形成的复合体。例如,细胞膜、线粒体、染色质和核糖体等。
按 BP, MF, CC 进行富集分析的方法
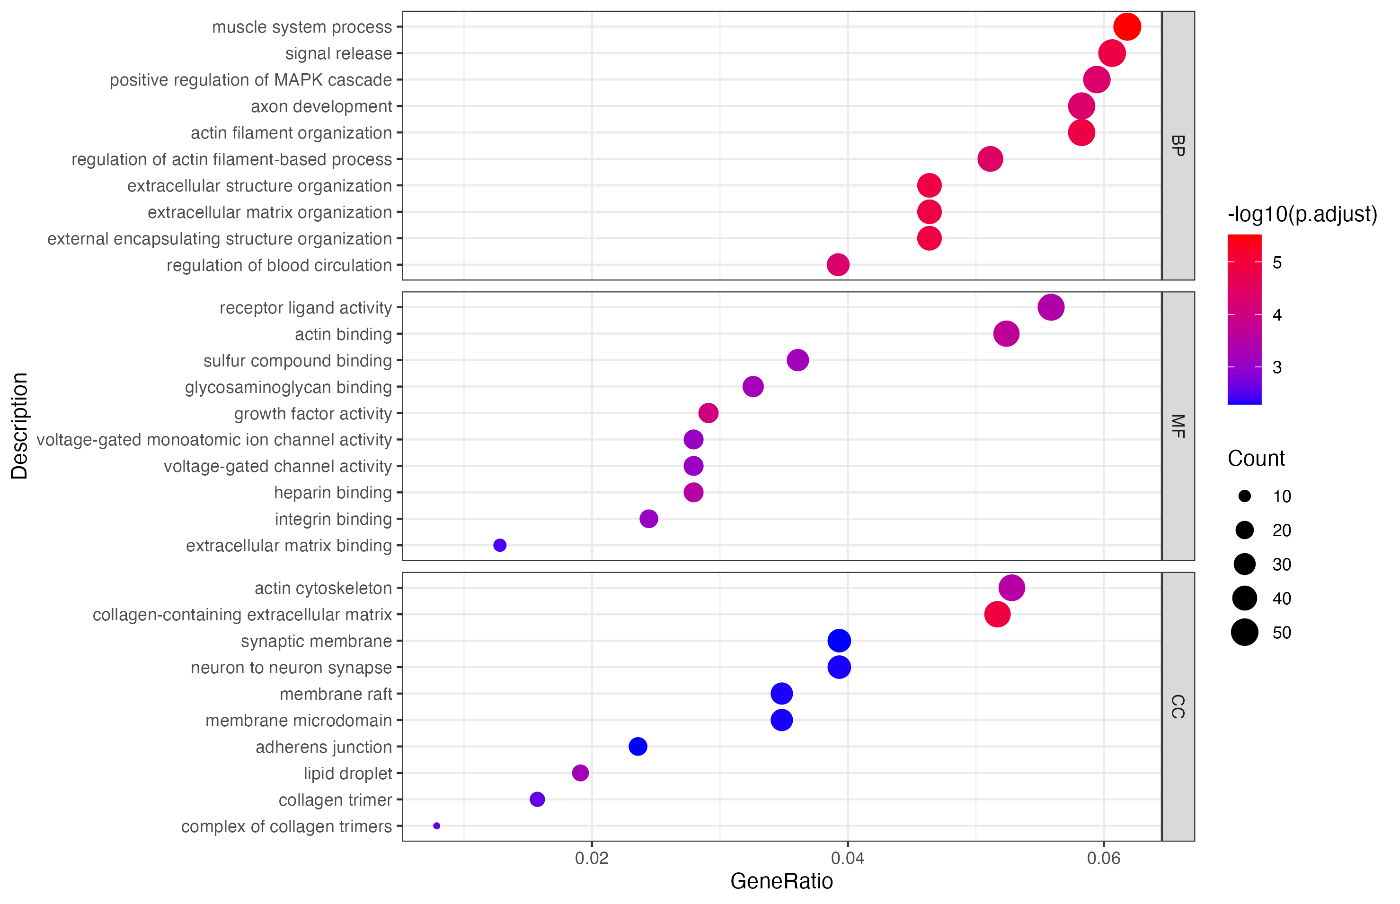
接下来介绍如何按 BP, MF, CC 进行富集分析的代码。我们使用绝对值、上调和下调三种基因集合进行分析,但只对绝对值进行可视化。此外,我们使用 facet_grid 函数将 BP, MF, CC 的图表合并到一个图中。为了避免图表过于复杂,每个类别只显示 10 个 term。
# 必需的库
library(readr)
library(ggplot2)
library(clusterProfiler)
library(AnnotationDbi)
library(org.Hs.eg.db)

gene_list <- read_csv("deseq2_results.csv")

# 将基因符号转换为Entrez ID
convertToEntrez <- function(genes) {
  mapIds(
    org.Hs.eg.db,
    keys = genes,
    column = "ENTREZID",
    keytype = "ENSEMBL",
    multiVals = "first"
  )
}

# 进行富集分析并获取唯一的top terms
performGoEnrichment <- function(entrez_ids) {
  list(
    BP = enrichGO(
      entrez_ids,
      OrgDb = "org.Hs.eg.db",
      ont = "BP",
      pAdjustMethod = "BH",
      qvalueCutoff = 0.05
    ),
    MF = enrichGO(
      entrez_ids,
      OrgDb = "org.Hs.eg.db",
      ont = "MF",
      pAdjustMethod = "BH",
      qvalueCutoff = 0.05
    ),
    CC = enrichGO(
      entrez_ids,
      OrgDb = "org.Hs.eg.db",
      ont = "CC",
      pAdjustMethod = "BH",
      qvalueCutoff = 0.05
    )
  )
}

# 假设你将DESeq2结果存储在变量"res_df"中
differentially_expressed_genes <- subset(
  gene_list, abs(log2FoldChange) > 1 & pvalue < 0.05
)
upregulated_genes <- subset(gene_list, log2FoldChange > 1 & pvalue < 0.05)
downregulated_genes <- subset(gene_list, log2FoldChange < -1 & pvalue < 0.05)

# 将基因符号转换为Entrez ID
entrez_ids_deg <- convertToEntrez(differentially_expressed_genes$...1)
entrez_ids_up <- convertToEntrez(upregulated_genes$...1)
entrez_ids_down <- convertToEntrez(downregulated_genes$...1)

# 富集分析
ego_deg <- performGoEnrichment(entrez_ids_deg)
ego_up <- performGoEnrichment(entrez_ids_up)
ego_down <- performGoEnrichment(entrez_ids_down)

visualizeGoEnrichment <- function(enrichment_results) {
  combined_plot <- lapply(enrichment_results, function(ego) {
    df <- as.data.frame(ego@result)

    # 将GeneRatio转换为小数
    parts <- strsplit(as.character(df$GeneRatio), "/")
    df$GeneRatio <- as.numeric(sapply(parts, `[`, 1)) /
      as.numeric(sapply(parts, `[`, 2))

    df$ont <- names(enrichment_results)[
      sapply(enrichment_results, function(x) identical(ego, x))
    ]

    # 选择p.adjust最小的前10行
    df <- df[order(df$p.adjust)[1:10], ]

    return(df)
  })
  combined_plot <- do.call(rbind, combined_plot)

  # 将'ont'列转换为有明确层次的因子
  combined_plot$ont <- factor(combined_plot$ont, levels = c("BP", "MF", "CC"))

  # 根据'GeneRatio'降序重新排序'Description'因子的层次
  combined_plot$Description <- reorder(
    combined_plot$Description, combined_plot$GeneRatio
  )

  ggplot(combined_plot, aes(x = GeneRatio, y = Description)) +
    geom_point(aes(size = Count, color = -log10(p.adjust))) +
    scale_color_continuous(low = "blue", high = "red") +
    facet_grid(ont ~ ., scales = "free_y") +
    theme(axis.text.x = element_text(angle = 45, hjust = 1)) +
    theme_bw()
}

# 绘图
p <- visualizeGoEnrichment(ego_deg)
print(p)
如果输出结果与预期一致,则表示成功!
代码解读
该代码用于从 RNA-Seq 数据分析中获得的差异表达基因列表进行 Gene Ontology (GO) 富集分析,并对结果进行可视化。以下是代码各部分的详细说明。
1. 加载库
library(readr)
library(ggplot2)
library(clusterProfiler)
加载所需的 R 包。
2. 读取数据
gene_list <- read_csv("deseq2_results.csv")
从 deseq2_results.csv 文件读取 DESeq2 的结果。
3. 将基因符号转换为 Entrez ID
convertToEntrez <- function(genes) {
   mapIds(
      org.Hs.eg.db,
      keys = genes,
      column = "ENTREZID",
      keytype = "ENSEMBL",
      multiVals = "first"
   )
}
定义一个函数,将基因符号转换为 Entrez ID。
4. 执行 GO 富集分析
performGoEnrichment <- function(entrez_ids) {
  list(
    BP = enrichGO(
      entrez_ids,
      OrgDb = "org.Hs.eg.db",
      ont = "BP",
      pAdjustMethod = "BH",
      qvalueCutoff = 0.05
    ),
    MF = enrichGO(
      entrez_ids,
      OrgDb = "org.Hs.eg.db",
      ont = "MF",
      pAdjustMethod = "BH",
      qvalueCutoff = 0.05
    ),
    CC = enrichGO(
      entrez_ids,
      OrgDb = "org.Hs.eg.db",
      ont = "CC",
      pAdjustMethod = "BH",
      qvalueCutoff = 0.05
    )
  )
}
定义一个函数,对给定的 Entrez ID 列表进行 GO 富集分析。
5. 选择差异表达基因
differentially_expressed_genes <- subset(
  gene_list, abs(log2FoldChange) > 1 & pvalue < 0.05
)
upregulated_genes <- subset(gene_list, log2FoldChange > 1 & pvalue < 0.05)
downregulated_genes <- subset(gene_list, log2FoldChange < -1 & pvalue < 0.05)
使用 log2 倍变化和 p 值标准,从基因列表中选择差异表达基因。
6. 转换为 Entrez ID
entrez_ids_deg <- convertToEntrez(differentially_expressed_genes$...1)
entrez_ids_up <- convertToEntrez(upregulated_genes$...1)
entrez_ids_down <- convertToEntrez(downregulated_genes$...1)
将选择的差异表达基因列表转换为 Entrez ID。
7. 执行富集分析
ego_deg <- performGoEnrichment(entrez_ids_deg)
ego_up <- performGoEnrichment(entrez_ids_up)
ego_down <- performGoEnrichment(entrez_ids_down)
使用之前定义的 performGoEnrichment 函数进行富集分析。
8. 可视化富集结果
visualizeGoEnrichment <- function(enrichment_results) {
  combined_plot <- lapply(enrichment_results, function(ego) {
    df <- as.data.frame(ego@result)

    # 将GeneRatio转换为小数
    parts <- strsplit(as.character(df$GeneRatio), "/")
    df$GeneRatio <- as.numeric(sapply(parts, `[`, 1)) /
      as.numeric(sapply(parts, `[`, 2))

    df$ont <- names(enrichment_results)[
      sapply(enrichment_results, function(x) identical(ego, x))
    ]

    # 选择p.adjust最小的前10行
    df <- df[order(df$p.adjust)[1:10], ]

    return(df)
  })
  combined_plot <- do.call(rbind, combined_plot)

  # 将'ont'列转换为有明确层次的因子
  combined_plot$ont <- factor(combined_plot$ont, levels = c("BP", "MF", "CC"))

  # 根据'GeneRatio'降序重新排序'Description'因子的层次
  combined_plot$Description <- reorder(
    combined_plot$Description, combined_plot$GeneRatio
  )

  ggplot(combined_plot, aes(x = GeneRatio, y = Description)) +
    geom_point(aes(size = Count, color = -log10(p.adjust))) +
    scale_color_continuous(low = "blue", high = "red") +
    facet_grid(ont ~ ., scales = "free_y") +
    theme(axis.text.x = element_text(angle = 45, hjust = 1)) +
    theme_bw()
}

# 绘图
p <- visualizeGoEnrichment(ego_deg)
print(p)
定义一个函数来可视化富集分析的结果,然后生成并显示图表。
总结
该代码通过以下步骤,从 RNA-Seq 数据中识别差异表达基因,并对其进行 GO 富集分析和可视化:
- 加载必要的 R 包。
- 从 CSV 文件读取 DESeq2 结果。
- 定义并执行函数将基因符号转换为 Entrez ID。
- 选择差异表达基因。
- 执行 GO 富集分析。
- 定义并执行函数可视化富集结果。